
How to Read Cuneiform Economic Tablets: Decoding Ration Lists, Price Records, and Hidden Mesopotamian Realities
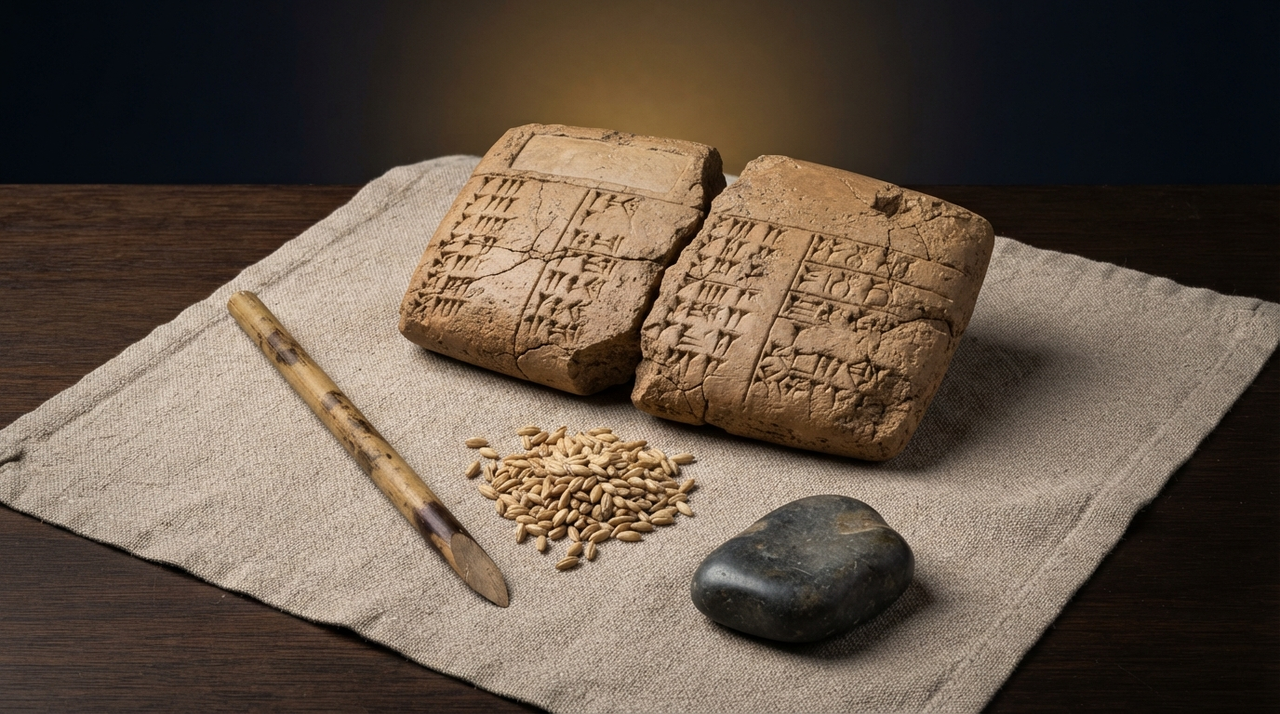
Picture a small lump of clay, no larger than your palm, resting in the dim light of a museum case. Its surface bears rows of wedge-shaped impressions, pressed into wet clay by a reed stylus over four thousand years ago. This is a cuneiform economic tablet, one of thousands unearthed from Mesopotamian archives in places like Nippur or Umma. It records barley allotments or silver equivalences, but it is no neutral ledger. It is a deliberate artifact, crafted by a scribe for a temple or palace household. To read it rightly demands seeing beyond the numbers to the human hands, institutional purposes, and vast silences it enshrines.
The Tablet as Object and Institution
Cuneiform economic tablets emerged in southern Mesopotamia during the Early Dynastic period around 2500 BCE, peaking in the Ur III era (2100-2000 BCE) and persisting into Old Babylonian times (2000-1600 BCE) and beyond. Scribes inscribed them on clay, often sun-dried for temporary use or kiln-fired for permanence. A stylus wedged signs into lines, sometimes sealed with a cylinder seal bearing the owner's name and authority.
These were not private diaries. Temples in Uruk or palaces in Isin commissioned them to track resources for the oikos, the institutional household encompassing laborers, priests, and livestock. Stored in archives by genre, they were copied, audited, or discarded. Reading primary sources like these starts with this physical and social frame: who held the stylus, under whose orders, and for what archive.
A Step-by-Step Method for Ancient Accounting
Approach cuneiform economic tablets as living documents, not spreadsheets. Follow these steps to decode ration lists and price tablets without imposing modern market lenses.
- Locate the context. Pin the tablet to place (Girsu?), period (Ur III?), institution (temple of Ningirsu?). Ur III administrative texts from Puzrish-Dagan document sheep herding for sacrifice, not profit.
- Identify genre and purpose. Is it a ration list allotting barley for labor, or a price tablet noting equivalences? Purpose reveals claims: accountability to superiors, not full economic truth.
- Parse units and measures. A guru (300 sila) of barley equals one month's allotment for an adult male. Silver shekels (8.4 grams) anchor equivalences, but vary by region and time.
- Spot actors and absences. Named individuals or categories (brewers, weavers) appear; family members or slaves often do not. Ask who commissions, who receives, who is omitted.
- Distinguish record from reality. A tallied 100 gur claims delivery or due payment. Lived exchanges involved reciprocity, coercion, or shortfall, unscribed.
This method grounds Mesopotamian administration in its terms: redistribution within households, not trade or taxation as we know them.
Ration Lists: Allotments, Not Welfare
What They Record
Ration lists from Ur III sites like Umma detail barley, oil, or wool issued to workers. Entries categorize by profession (ox-drivers, reed-weavers), gender, and sometimes dependents. Quantities scale: more for men, half for women, less for children. These are allotments for corvée labor or institutional service, sustaining the palace or temple workforce.
Limits of the Genre
"Ration" implies bare subsistence, yet allotments often sufficed for survival amid seasonal harvests. They track institutional outflows, ignoring household production like home-spun cloth or garden yields that fed most lives.
Price Tablets: Equivalences, Not Markets
Old Babylonian price tablets from Sippar or Larsa list ratios: one shekel of silver for 180-300 sila of barley, or for dates, wool, or labor days. These are recorded equivalences for accounting, drawn from temple valuations or disputes. They do not prove bustling bazaars; informal reciprocity or barter filled gaps. Neo-Assyrian records from Nineveh extend this, equating iron tools to grain for royal estates.
Scholars debate if these hint at proto-markets, but context favors institutional fixed rates over free exchange. Numbers stabilize claims, hiding negotiation or debt forgiveness.
The Hidden Layers: What Numbers Conceal
Tablets spotlight institutional flows: labor for barley, silver for goods. Absent are unpaid household production, women's brewing or childcare, reciprocal gifts among kin, coerced corvée, or seasonal debts. Property was communal in temples; debt tablets show personal pledges, but most exchanges evaded writing. Power skews visibility: elites commissioned scribes, rendering smallholders invisible.
A clay tablet with barley figures is not a spreadsheet of GDP. It is a made object: written by someone, for an institution, leaving most of life off the tablet.
Echoes in Later Records
Roman tax registers or medieval manorial rolls share this: tallies for lords, silent on peasant gardens. The habit persists: query commissioner, units, claims, silences. No linear march to modern accounting; each era demands its own reading.
Practice on a Real Tablet
Visit the Cuneiform Digital Library Initiative (CDLI) or the Penn Museum. Select an Ur III ration list. Apply the steps. What institution? Whose labor? What measure? What ghosts lurk unnamed? This method links to History's archives, Writing's craft, Politics' power, and Business' ledgers. In questioning the clay, you uncover Mesopotamian realities, one wedge at a time.